Airbnb’s Going Public || Breaking Down Their S-1
They're a first-class company & should be ‘housed’ in an investment portfolio as a “buy”.
Written whilst scrolling through Norwegian fjord homes with saunas on Airbnb.
Airbnb’s S-1 came out recently. From it, I’m impressed with the company, cautious about the short term stock price right after IPO, and optimistic about a long term that will bring growth interspersed with frequent volatility. COVID was the apocalypse for a company like Airbnb yet promisingly, it proved that Airbnb’s business model and marketplace dominance are unparalleled. The real question of how Airbnb will do in the public markets depends on how it hits (or misses) their publicly set revenue targets and growth timelines. Airbnb recognizes this: 73 pages of their 300+ paged S-1 are dedicated to “Risks”, one of the largest risk sections I’ve ever seen.
2 min TL;DR. Top takeaways ‘lodged’ here.
COVID showed off Airbnb’s strength. A travel analogy seems only fitting - COVID kicked up a category 5 storm and Airbnb pulled their Boeing 747 above the clouds after some initial turbulence. It’s true that air masks descended, beverage carts overturned, and suitcases tumbled about - Airbnb’s bookings decreased by 72%, cancellations became 122% of gross bookings, 25% of employees were laid off, and $2B of emergency cash was needed. Yet relatively, the business soared - revenue from Experiences increased dramatically, long term stays grew to 24% of revenue, local stays rose, company costs were quickly decreased by 22%, and revenue rebounded faster than the rest of the hard-hit travel industry. As a result, from July through Sep, bookings were down only 20% year over year.
Airbnb dominates as a company. Why has, and why will, Airbnb continue to be leading the travel pack? Because people want to travel more and be immersed in local culture. Airbnb stands apart with its competitive moats of brand equity, expansiveness of offerings (100k cities in 220 countries), host & guest acquisition and retention, unique travel offerings, and P&L management.
Market challenges will always be significant. However, market-wise, there is huge volatility that is often outside of Airbnb’s control. In the short term, there’s going to be price frothiness because they are IPO-ing at a higher pre-COVID-based valuation whilst they are still in the midst of COVID. In the long term, there are large, ongoing cash needs for new initiatives & expansion into places like China, increasing government regulations, large tax implications, the question of true market size that Airbnb can grow into, potential dual-class voting structure downsides, and the lack of control on its own reputation.
The stock is a buy, just not around IPO time. Overall, I’d say any investor willing to be on a bumpy, but upward ride in the long term should consider this stock as a “buy”. However, I’d caution against buying them right after they goes public. The resurgence of COVID cases + Airbnb’s naturally inconsistent business + excited but skittish investors who tend to flock around IPO = trading volatility for the first months. Hitting revenue targets and new initiative timelines will be especially unpredictable during these COVID times. Hence, the fundamentals of the business are there, there’s just no need to join the starting line frenzy. It’s a marathon, buy a mile or two in.
Valuation & Voting Rights Overview
IPO update: Valuation looks to be ~$100B on opening day. This is 3x its initial valuation and 2x its IPO price of $68 /share
Thoughts on buying @ IPO: how long will it take Airbnb to double in value to $200B? Is it overvalued right now? While I believe it’s a winner long term, I’d consider whether right now, the opportunity cost of using my capital is best spent on something else and to sit out the price specualtion right now*
Prior street projections for IPO: ~$30B valuation. They were valued at $18B in April when they had to raise $2B in debt from investors
Even though Airbnb’s 2020 revenue was compressed from COVID, they are valuing their business based on non-COVID times as this is more reflective of normal status quo
4 classes of shares
Class A with 1 vote per share
Class B with 20 votes per share (founders / senior exec only)
Class C - no voting rights
Class H - no voting rights
No dividends
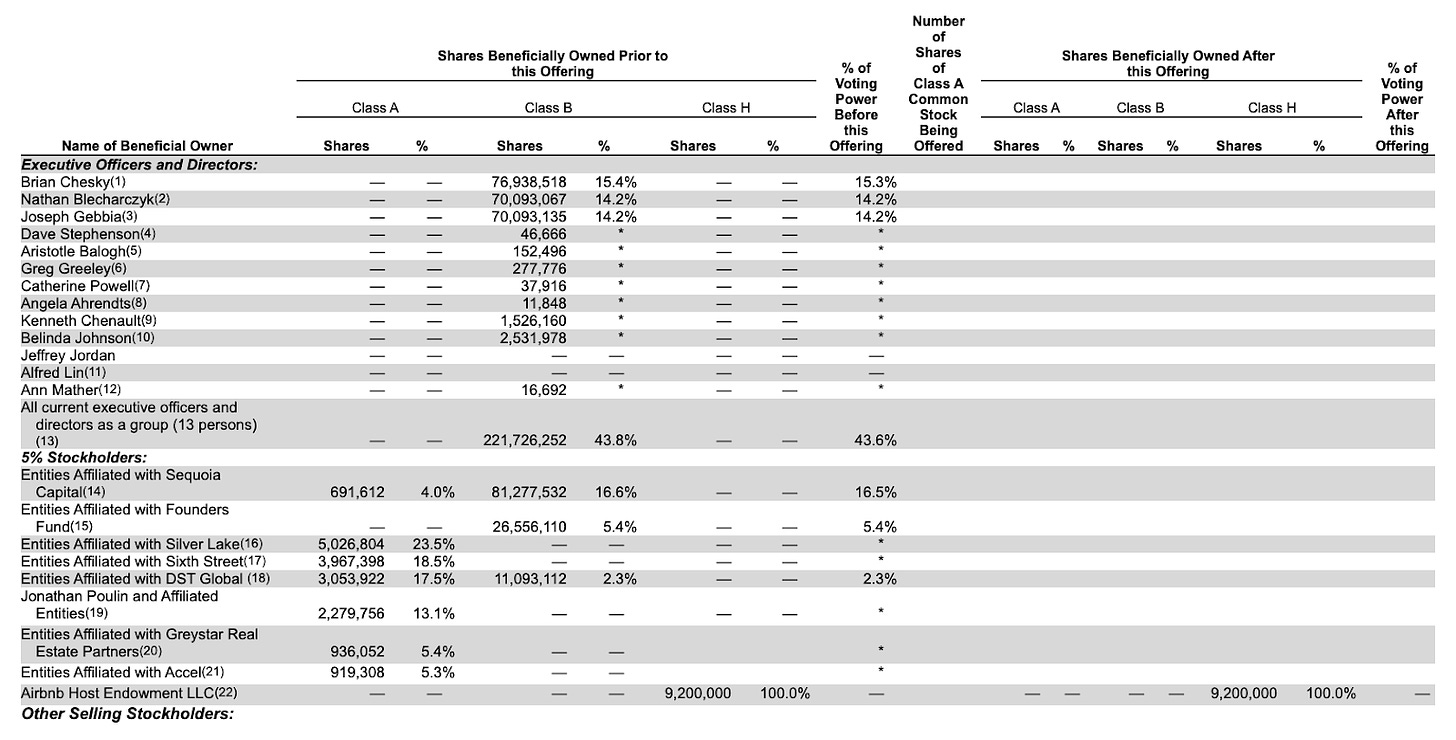
Exec & primary shareholders’ holdings below:
10 min Deep Dive || Strengths & Weaknesses
STRENGTHS OF AIRBNB
Airbnb has an unparalleled value proposition.
Airbnb is about redefining the limits of travel. Airbnb is about making anywhere in the world, accessible for any traveler who wants to immerse themselves in the local culture. It’s not just a hotel room in a touristy area of a major city, it’s about local immersion through stays and experiences. Hotel and resort conglomerates haven’t been as quick to recognize and replicate the feel of a personal home while house shares like VRBO are losing market share to Airbnb’s name recognition, trust from reviews and payment platform, and a more intuitively built & designed platform.
Brand equity sets them about the rest.
My grandmother in Shanghai knows about Airbnb. My mom books some of her trips through it. My friends and I use it as our go-to trip planner. While anecdotal, Airbnb’s brand recognition is paramount to its success - in a survey, 74% of guests responded that Airbnb is best for trips to explore new areas. Airbnb is about redefining travel and to support this, Airbnb must be a “truly iconic brand” that optimizes on five key brand attributes sets them apart - instant visual recognition, universal value proposition, playing a role in culture, standing for more than the service they sell, and finally, creating an emotional connection. As a result, they are not only design & mobile-optimized, but also they have both hosts and guests trusting the platform’s reviews, customer service, and payments and bookings to be reliable no matter what country the booking is located.
Topline growth + the ability to quickly minimize costs are a winning formula.
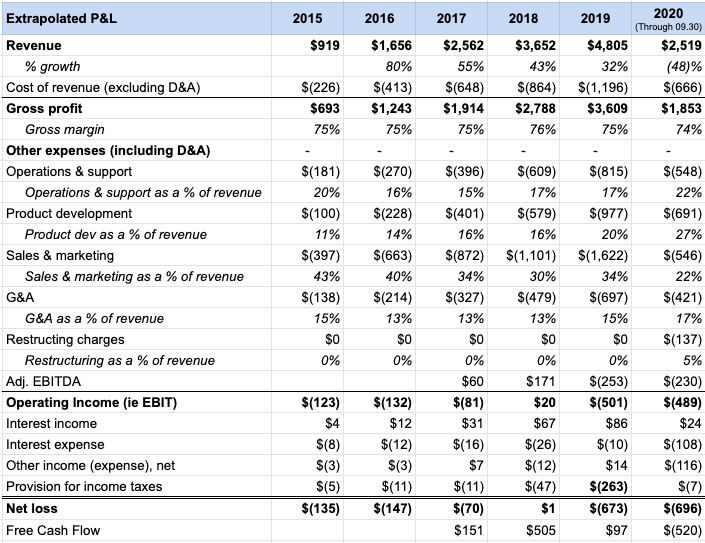
There’s nowhere to hide with numbers. And Airbnb’s numbers tell a story of a business that is effectively run. The business is growing and is resilient in spite of taking a tremendous amount of cash to innovate and expand. Since 2015 (the earliest reported year in the S-1), Airbnb has grown double-digit percentages until 2020. This growth is especially impressive given that the projected travel spend market has just a 3.5% CAGR from 2019 through 2030. While expenses may be high, Airbnb’s are manageable as most of them come from sales & marketing, product development, and employees. In COVID, they were able to decrease costs quickly by ~$150M.
In terms of resilience, COVID is the optimal case study. In a time where travel came to a grounding halt, there’s been a rebound in the latter half of 2020. Compared to bookings being down 72% year over year overall, bookings were only down 20% from July through September. Instead of no travel, guests switched to longer stay bookings (24% of bookings in 2020 versus 19% in 2019), more domestic stays, and more Experience bookings. With their ever-expanding array of offerings like Experiences, Luxe, Plus, hotels, and more across 220 countries, Airbnb is diversified to weather any storms to continue their growth.
Airbnb attracts hosts who are in turn, incentivized to stay with the platform.
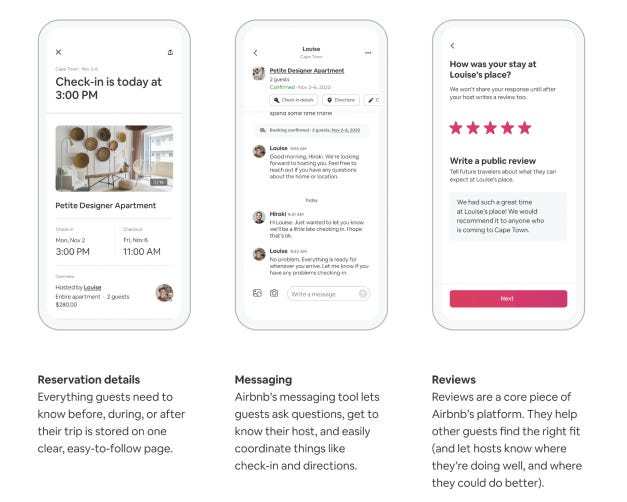
Inventory on the platform, and in turn hosts, are core to Airbnb’s platform. Acquisition wise, 2019 saw Airbnb adding the most hosts they ever have in any given year. In fact, 23% of new hosts were guests originally. While repeat listings with reviews get the most bookings, the low barrier to entry is attractive to hosts - within 4 days of listing, 50% of hosts get their first book. Within 16 days, 75% get their first bookings. Plus, Airbnb makes it easy to price listings and start earning money - as seen below, monthly revenue is estimated and pricing tools based on home attributes are built into the platform.
Retention wise, 84% of revenue is from repeat hosts. As an incentive, great hosts are rewarded - they earn SuperHost statuses, are considered for Plus listings, and the search algorithm pushes their listings to the top of the pack. Today, there are 5.6M active listings from 4M hosts. With the average number of listings at 1.4 per host, it’s evident that Airbnb has become a nontrivial revenue stream for hosts.
The LTV/CAC for customers is promising.
Acquisition wise, 91% of all traffic on Airbnb is through direct or unpaid channels in 2020. So it’s a low cost of acquisition (“CAC”) to attract guests and click-throughs to the site. Then, once on the platform, Airbnb’s supply converts guests who may browse other booking platforms. And not just in an Uber way where supply is relatively homogeneous: Airbnb has a big variety of price points, locations (100+ cities around 220 countries), interior styles, and home amenities. Fun fact, there are about 1,600 private islands for rent along with unusual properties like a 6 ton Idaho spud home #goals
Not only is CAC relatively low given organic traffic and brand recognition, but also, Airbnb retains their guests - 69% of all revenue was generated by stays from repeat guests. 68% of guests leave reviews, and there have been 430M reviews left. Over time, top-rated properties are visible to guests and more information is available - is the set-up good for working remote, is there A/C, are there cute bodegas nearby. Not only is the average stay 5 to 6 days, but there are more products for guests to use - Experiences, long term stays of more than 28 days, Luxe properties in ever-expanding places in the world. The network effect between guests and hosts shows how growth engenders growth.
WEAKNESSES OF AIRBNB
Reputation and the ability to maintain trust is out of their hands.
At the end of the day, Airbnb is a marketplace. This means that while they can set host and guest guidelines, they have to rely on these outside parties to act in good faith and to report when there are issues. Ultimately, this means they are often only able to be reactive to issues that arise - for example, despite their announced crackdown on parties in 2019 because of violence that erupted, more shootings like the one in Sacramento this year happened. When listings don’t match the pictures and description, guests can be left trying to contact Airbnb from a foreign country and scrambling to find alternative lodging in the middle of the night (there is a website called AirbnbHell dedicated to these types of stories). Plus, customer service is at odds with engendering trust with hosts - for instance, the decision that Airbnb made to fully refund customers during COVID left many hosts feeling betrayed.
Total addressable market sizings may be drastically off.
SAM (serviceable addressable market) today is estimated to be $1.5T. $1.2T is from short term stays and the remaining 20% from experiences. Long-term TAM (total addressable market) is estimated to be $3.4T, including $1.8T for short term stays, $0.2T from long term stays, and $1.4T in Experiences.
There are assumptions that are not tested - for example, in the $0.2T long term stays, Airbnb is calculating that they will take over the entire $48B global serviced apartment market and 10% of the $1.6T global residential rental market. They admit in the S-1 that while they’re seeing an increase in long term stays, there is no outside data to lend to this assumption. Then, estimates for TAM are based on their assumptions that more people will travel as the population increases. Airbnb is banking on travel behaviors changing because of their platform - people will travel more often and for longer as Airbnb becomes more of the reason why people take trips in the first place. Finally, the assumptions going into experiences’ jump from revenue in SAM going from 20% to almost half of the business is not fully explained. In short, it isn’t that TAM is necessarily incorrect but rather, these are oversimplified assumptions of which single-digit percentages make billions of dollars of difference.
A dual-class voting structure gives outsized control to founders who are difficult to oust.
Dual-class voting structure refers to how senior execs and / or founders have a special class of shares that gives them voting control in a company. It’s an increasing part of tech companies’ IPOs - Lyft, Pinterest, Facebook, Zoom, Chewy, & Doordash all have them. However, Airbnb’s Class B shares have some of the most outsized voting rights - each Class B share is worth 20 votes. For context, Google is 10:1. The point of dual-class structures is to insulate founders and CEOs from being quickly voted out as their company moves to a quarter by quarter public reporting structure that may want short term changes. However, this structure also keeps poor managers at the helm of a sinking ship. WeWork and Uber demonstrate this. Airbnb has been well-run up to this point, but I am cautious about the founders having this amount of control as removing them will be difficult if things go south. Plus, having two other classes of shares (Class C & H) without voting rights is controversial - Snapchat’s 2017 IPO sparked backlash when it sold stock without voting rights.
Growth costs are high and hard to predict.
Growth comes at a cost as Airbnb is a cash-extensive business. Because of investment into areas like China and growth initiatives like Experiences, Plus in 2019, the company achieved 75% of their expectations even with all this additional spend. Areas like income tax liabilities are uncertain - Airbnb recently received an IRS notice for the 2013 tax year that could increase their US taxable bill by $1.35B, excluding additional penalties and interest. Instead of treading towards profitability, Airbnb is having to step further away to prioritize growth.
The natural volatility of their global business model is at odds with becoming a publicly-traded company.
As Airbnb continues to expand internationally, they get more entangled with more disparate tax, government, and data regulations. Not only is this costly to sort out, but also these situations can delay progress on projects. For example, China is a focus for Airbnb yet due to regulations, Airbnb needs to operate through a variable interest entity as foreign involvement is limited. This impacts the amount of control and the timeline of results in China. In contrast, public companies’ values fluctuate based on how accurately and timely companies are able to deliver results - while Airbnb is likely to be a success long term, their model could put their stock in volatile swings as they expand into more of a globally diversified brand.
IPO-ing right now isn’t necessarily optimal timing.
The end of Q4 isn’t usually busy months for IPOs, but Airbnb is just one of many big names like DoorDash, Affirm, and Roblox, to file S-1s during this time. While I feel optimistic about Airbnb’s business growth long term, IPO-ing right as they come out of their toughest period to date of COVID means there is a spectrum of belief in the market about Airbnb’s value. Post-COVID with strong recovery numbers would strengthen their valuation out of the gates. Therefore, I have to assume that they are optimizing around other factors such as equity grants of company OGs that begin expiring in Nov 2020 rather than truly seeking the optimal time to IPO. This will create more post-IPO churn that I’d recommend investors stay clear of for a few months past going public
Appendix
Appendix || What other information I would have liked to see
Pre 2015 financials. Given that the company started 8 years before 2015, it would be helpful to get a sense of year over year growth. While growth has been in the high double digits year over year, the percentage has been decreasing. Still, 6 years of data is generous for a S-1.
Units economics for Airbnb, its hosts, & guests. Unit economics would speak to Airbnb’s profitability and the incentive for hosts and guests to keep using the platform. We know that Airbnb’s core is hosts and that they charge guests more than hosts but no concrete numbers are given.
International revenue broken out by regions. Given that their $3.4B TAM estimate is based on $1.5T in Asia, $1.0T in EMEA, $0.7T in North America, & $0.2 in LatAm, I’d like to see revenue broken out by region. This will help illuminate the likelihood and timeline of when they’ll reach this TAM. I do like their breakout of GBV and average nights per booking by region.
Revenue broken out by entity and asset type over time. Experiences, long term stays, short term stays, Airbnb Plus, hotels, Airbnb Luxe, full home or room. It’d be good to shed more light on why 25% of listings have churned and what customer booking trends are.
Types of properties that are booked. In 2019 and 2020, Airbnb’s ADR (average daily rate, which is the hospitality & lodging KPI for the nightly rate charged) was $110 and $124 respectively. While this is higher than the US’ ADR of $99 and $103 respectively, it’s unclear whether Airbnb is truly enticing customers that are seeking a locally immersed experienced rather than a cost-conscious traveler. Therefore, urban vs suburban, full house or apt vs a private room in a shared house, etc would be usual to understand the customer demo they face.
Appendix || General Info
Founded in 2007 in SF
220 countries, 100k cities
4M hosts of which, 55% are women
5.6M active listings, 7.4M listings ⇒ 25% churn
Avg stay of 5 to 6 days
825M guests
No single city accounts for more than 1.5% of revenue
The top 10 cities are London, NYC, Paris, LA, Rome, Barcelona, Tokyo, Toronto, San Diego, & Lisbon
These top 10 cities made up 12% of all of Airbnb’s 2019 revenue
* Financial disclaimer: On all investments, please do your own research. I am not a financial advisor and am just sharing my own perspective.







Thanks for writing this is amazingly interesting.
Is there a data set you could share which allow ls for further analysis?
I'd love to share my insights with you:)
Thanks for the write-up. What are your thoughts on the CEO donating a large amount of his stock compensation to their Host Endowment Fund? Gimmick or long-term stakeholder alignment?